Publication Highlights
U.S. Adolescent Rest-Activity patterns: insights from functional principal component analysis (NHANES 2011–2014)
International Journal of Behavioral Nutrition and Physical Activity. 2023;20(1):125.Inadequate rest-activity patterns during adolescence can lead to adverse health outcomes in adulthood. Identifying sociodemographic factors influencing these patterns can help target interventions. Using data from NHANES 2011–2014 on 1,814 adolescents, we identified four rest-activity profiles. These patterns varied with age, sex, race/ethnicity, and household income. For example, older adolescents had prolonged activity, girls had shorter rest periods, and different racial groups showed distinct patterns. Lower income was linked to earlier activity. Our findings highlight the impact of demographic and socioeconomic factors on adolescent rest-activity behaviors. Get Full Text

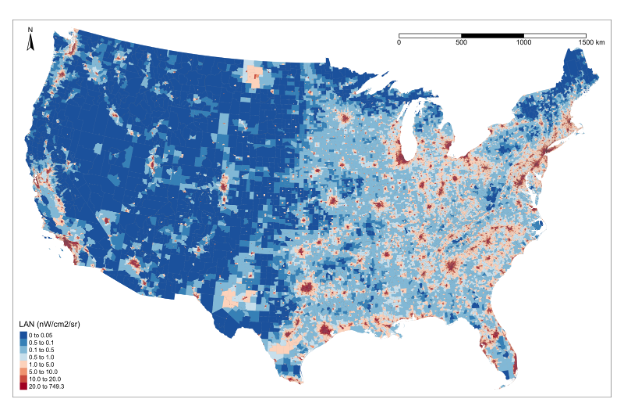
Alignment Between 24-h Light-Dark and Activity-Rest Rhythms Is Associated With Diabetes and Glucose Metabolism in a Nationally Representative Sample of American Adults
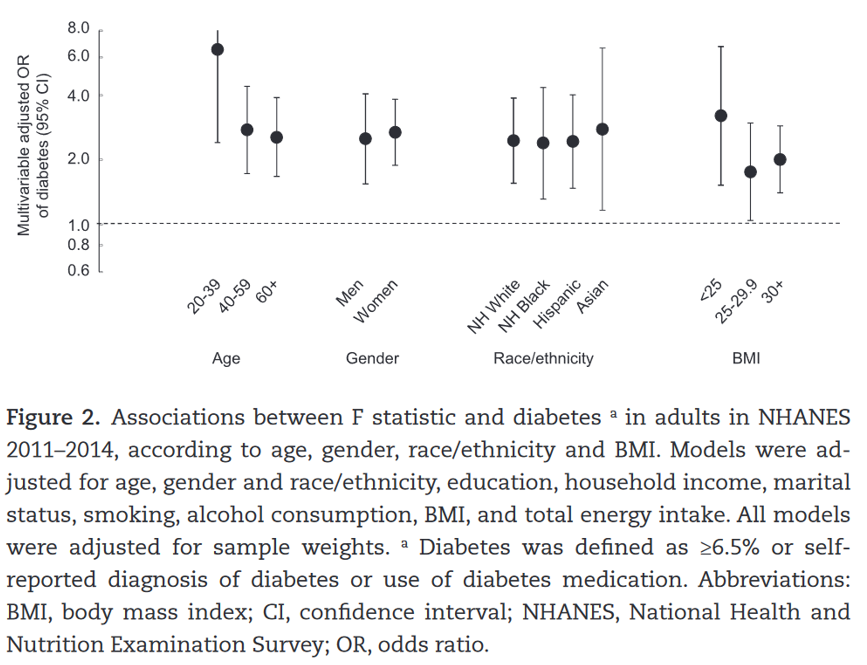
Diabetes Care. Published online September 21, 2023:dc231034.The alignment between environmental cues (e.g., light) and behavior cycles (e.g., rest) is crucial for metabolic health. Using data from 7,000 adults from the National Health and Nutrition Examination Survey (2011–2014), we assessed the relationship between activity-rest and light-dark cycles. We found that weaker alignment and more delayed activity relative to light were associated with diabetes. Specifically, those with the most misaligned patterns had over a 70% increased risk of diabetes. This indicates the importance of 24-hour activity-light alignment in metabolic health. Get Full Text
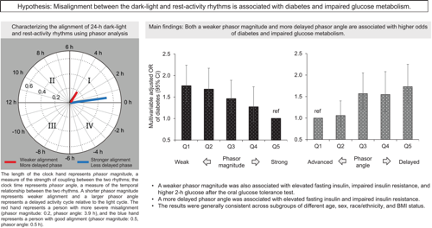
Artificial Light at Night and Social Vulnerability: An Environmental Justice Analysis in the U.S. 2012-2019
Environment International 178(9):108096.We analyzed the relationship between Artificial Light at Night (ALAN) and social disadvantage using NASA's Black Marble satellite data and the CDC's Social Vulnerability Index across over 70,000 US census tracts. Our findings revealed that the most socially vulnerable communities experienced ALAN levels 2.46 times higher than the least vulnerable, with minority and language status being significant predictors. This suggests that ALAN is not only an environmental justice concern but also carries potential health implications. Get Full Text
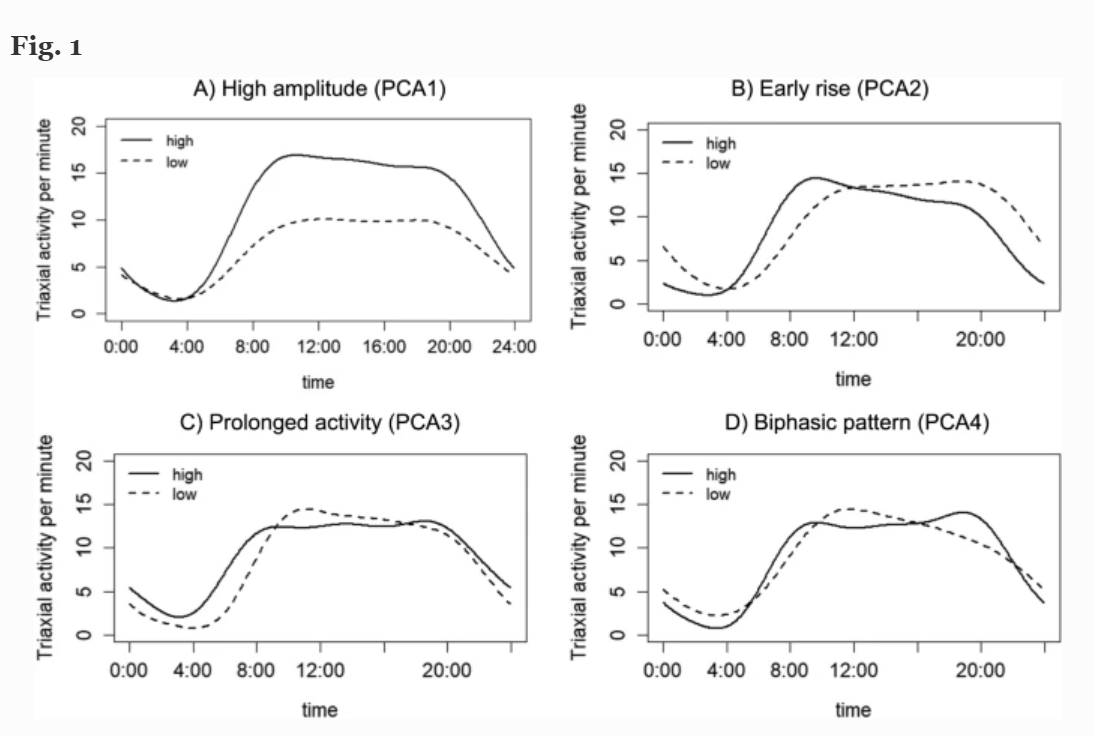
Rest-activity profiles among U.S. adults in a nationally representative sample: a functional principal component analysis
Int J Behav Nutr Phys Act. 2022;19:32.We identified four distinctive rest-activity profiles from 24-hour actigraphy using the functional principal components approach. Our association study provided abundant evidence suggesting that sociodemographic characteristics can shape rest-activity patterns, and these profiles are highly correlated with health status. Get Full Text
The association between rest-activity rhythms and glycemic markers: the US National Health and Nutrition Examination Survey
Sleep. 2021;zsab291. PMID: 34897522.We investigated the association between rest-activity characteristics derived from extended cosinor models and multiple glycemic markers across different demographics. Our findings suggest that weakened or disrupted rest-activity rhythm is associated with impaired glycemic control. Get Full Text
Real-time geospatial analysis identifies gaps in COVID-19 vaccination in a minority population
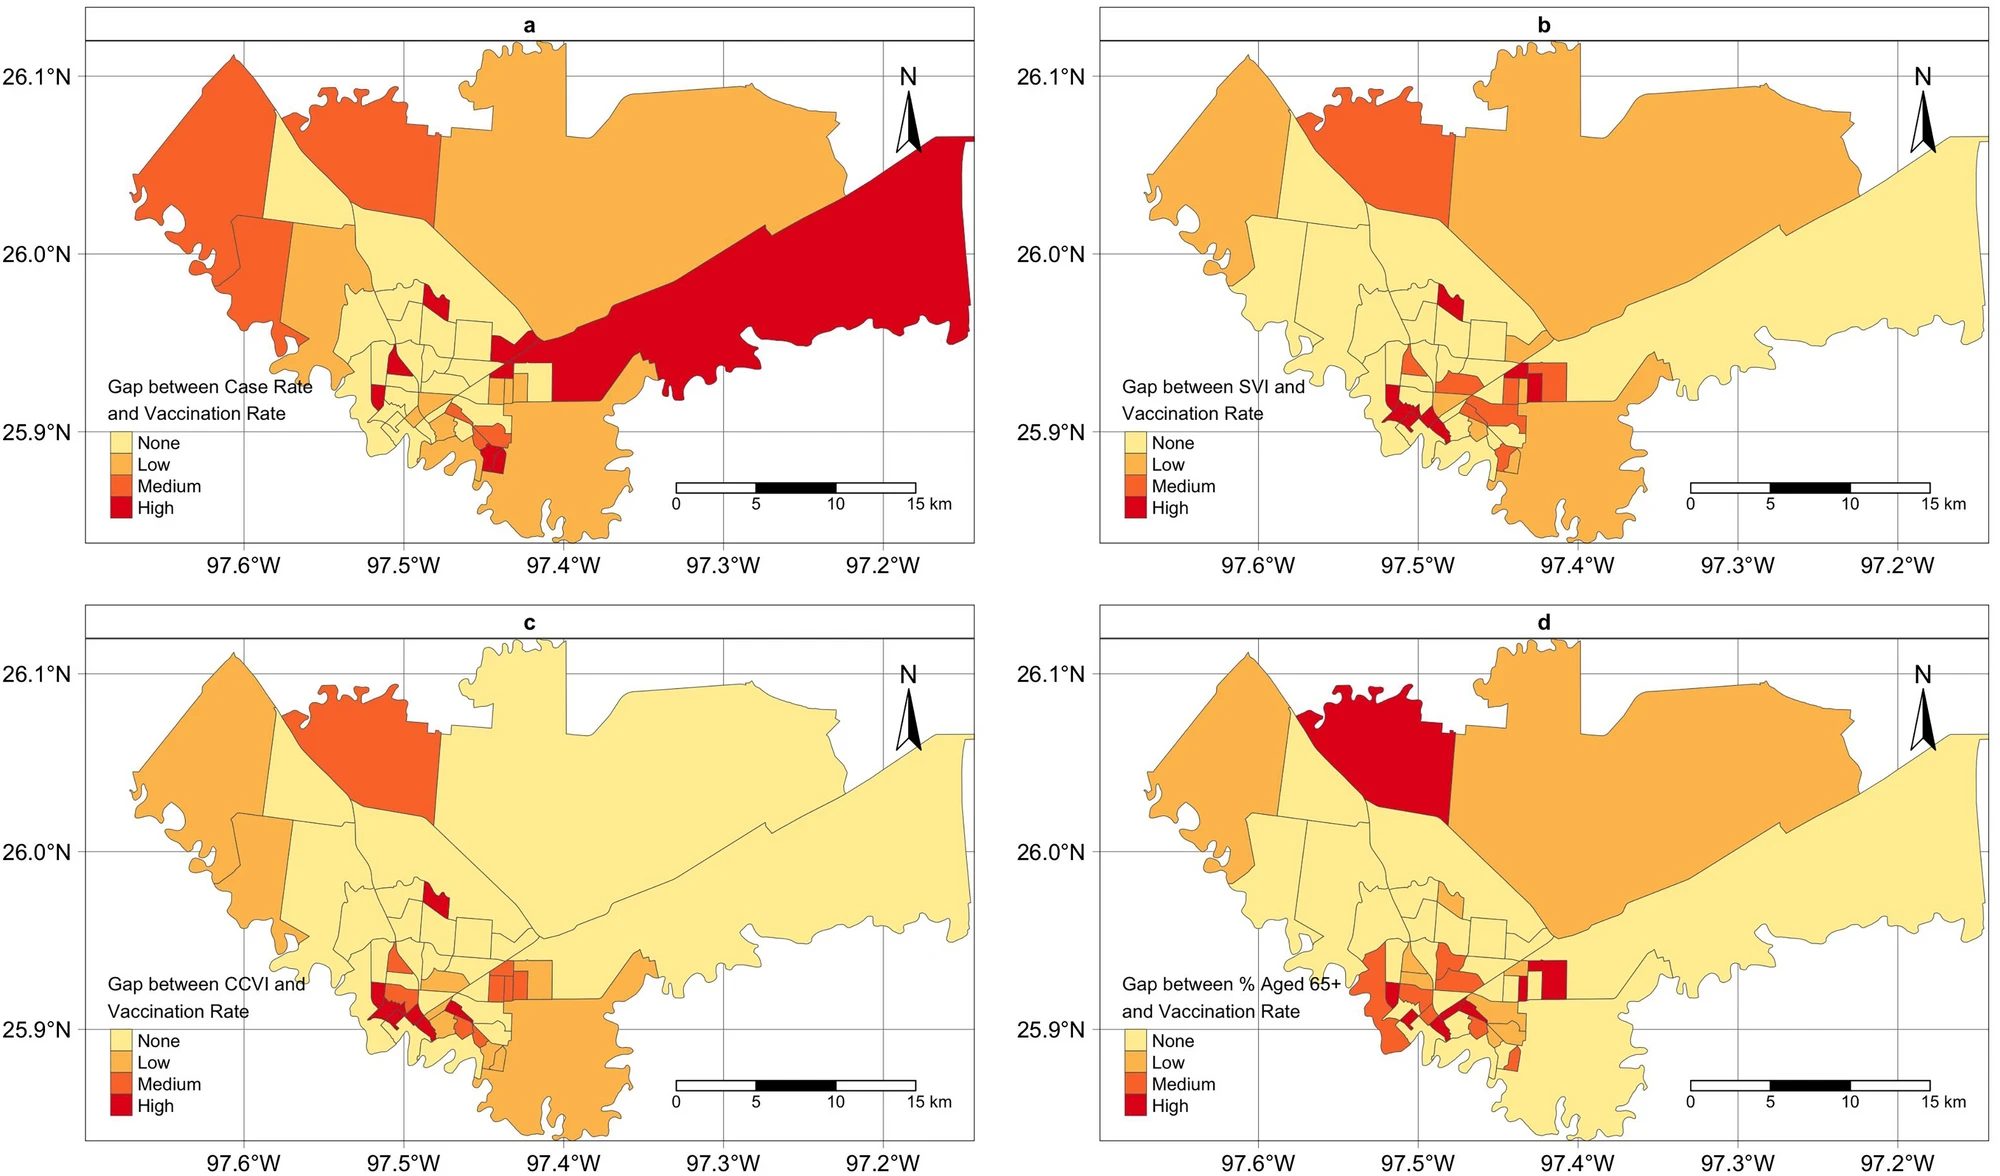
Sci Rep. 2021 Sep 13;11(1):18117. PMID: 34518570. PMCID: PMC8437959.We reported the effective use of real-time geospatial analysis to identify barriers and gaps in COVID-19 vaccination in a minority population living in South Texas on the US-Mexico Border, to inform vaccination campaign strategies. We developed 4 rank-based approaches to evaluate the vaccination gap at the census tract level, which considered both population vulnerability and vaccination priority and eligibility. We identified areas with the highest vaccination gaps using different assessment approaches. Get Full Text
Census Tract Patterns and Contextual Social Determinants of Health Associated With COVID-19 in a Hispanic Population From South Texas: A Spatiotemporal Perspective
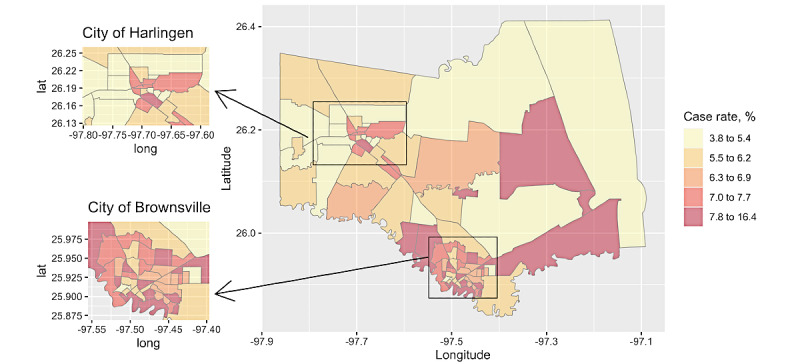
JMIR Public Health and Surveill. 2021 Aug 5;7(8):e29205. PMID: 34081608.PMCID: PMC8354426. (IF 4.11)We investigated the contextual SDOH and their potential association with COVID-19 incidence at the census tract level. Our analysis provided a look at the SDOH at sufficient spatial granularity to detect local trends and hot spots for COVID-19 monitoring and control. Get Full Text
Patterns and risk factors of opioid-suspected EMS overdose in Houston metropolitan area, 2015-2019: A Bayesian spatiotemporal analysis
PLOS One. 2021;16(3):e0247050. PMID:33705402. PMCID: PMC7951926. (IF 3.24)We relied on emergency medical services data to investigate the geographical and temporal patterns in opioid-suspected overdose incidents in one of the largest and most ethnically diverse metropolitan areas (Houston Texas). Using a cross sectional design and Bayesian spatiotemporal models, we identified zip code areas with excessive opioid-suspected incidents, and assessed how the incidence risks were associated with zip code level socioeconomic characteristics. Get Full Text

Individual and Community Social Determinants of Health Associated With Diabetes Management in a Mexican American Population
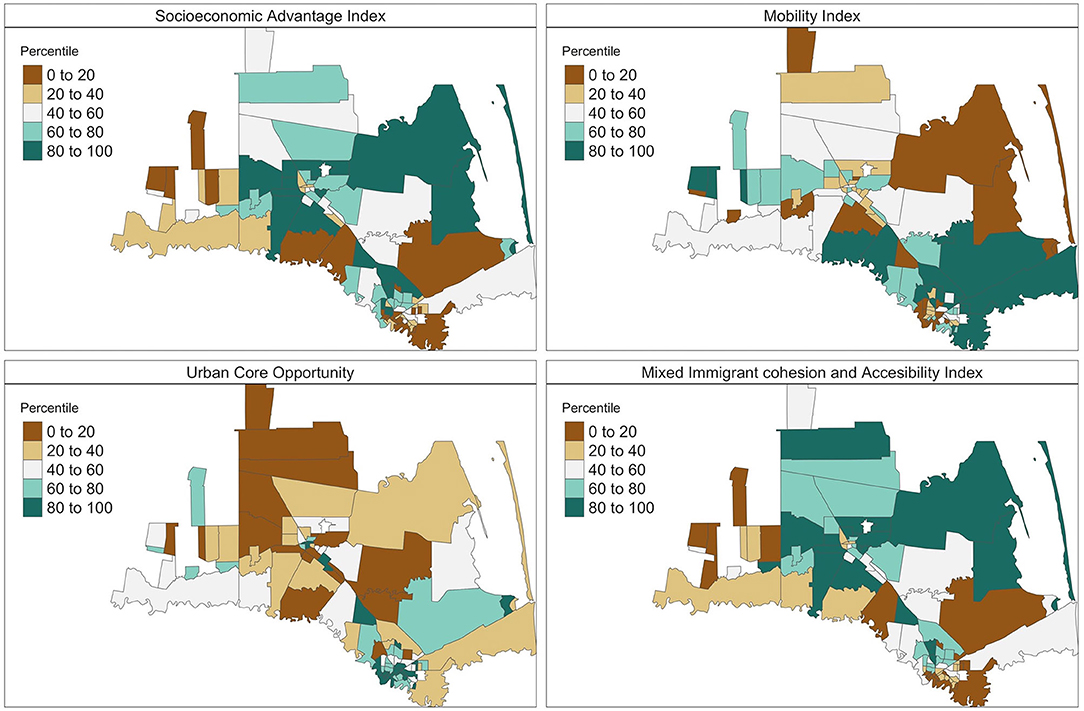
Frontiers in Public Health. 2021;8:633340. PMID: 33614572. PMCID: PMC7888279. (IF 3.71)This study performed a secondary data analysis on 1,568 individuals who participated in Salud y Vida (SyV), a local diabetes and chronic disease management program, between October 2013 and September 2018 recruited from a local clinic. We developed the community-level indices representing different domains. Using Bayesian multilevel spatial models that account for the geographic dependency, we were able to simultaneously investigate the individual- and community-level SDOH that may impact HbA1C reduction. Get Full Text
Spatial epidemiology: An empirical framework for syndemics research
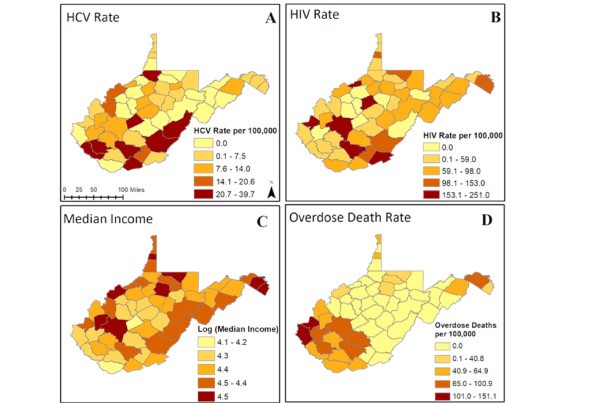
Social Science & Medicine. 2020 Sep 10;:113352. PMID: 32950331.PMCID: PMC7962030. (IF 4.63)In this paper, we provide a brief introduction to spatial epidemiologic methods as applied to syndemics research. We describe spatial epidemiologic data and methods by drawing comparisons with non-spatial data. We then present a case study to elaborate on the applications of spatial epidemiologic methods for syndemics research. Get Full Text
The impact of imperfect screening tools on measuring the prevalence of epilepsy and headaches in Burkina Faso
PLOS Neglected Tropical Diseases. 2019;13(1):e0007109. PMID: 30653519.PMCID: PMC6353216.(IF 3.89)This study demonstrates that in some settings, the prevalence of epilepsy and WSCH can be considerably underestimated when using the two-step approach. We provide an analytic solution to obtain more valid prevalence estimates of these neurological disorders, although more community-based validity studies are needed to reduce the uncertainty of the estimates. Get Full Text
Stratified space–time infectious disease modelling, with an application to hand, foot and mouth disease in China
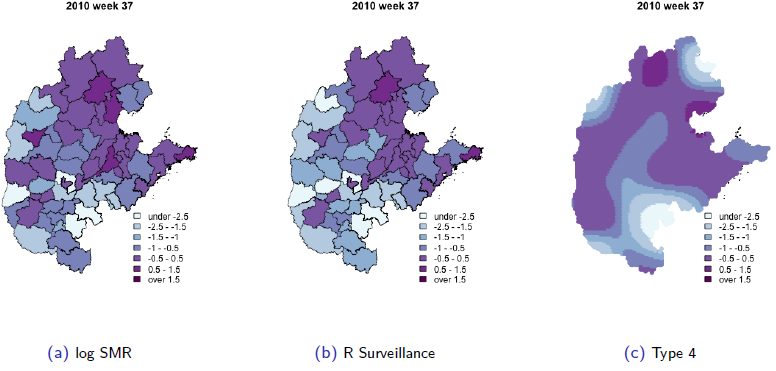
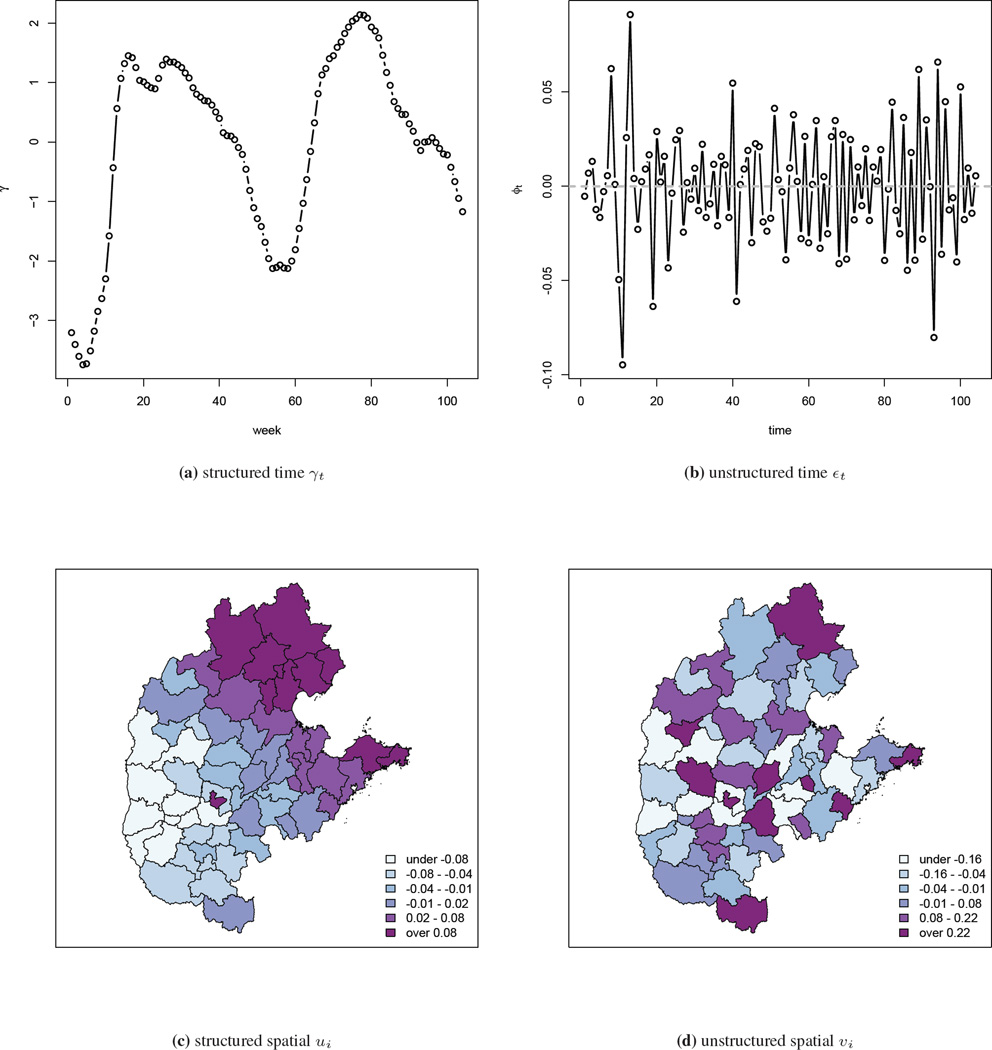
Journal of the Royal Statistical Society Series C.2018;67:1379-1398. (IF 1.77)We extend an interesting class of space–time models for infectious disease data proposed by Held and co-workers, to analyse data on hand, foot and mouth disease, collected in the central north region of China over 2009–2011. We provide a careful derivation of the model and extend the model class in two directions. First, we model the disease transmission between age–gender strata, in addition to space and time. Second, we use our model for inference on effective local reproductive numbers. Get Full Text
Time series modeling of pathogen-specific disease probabilities with incomplete data
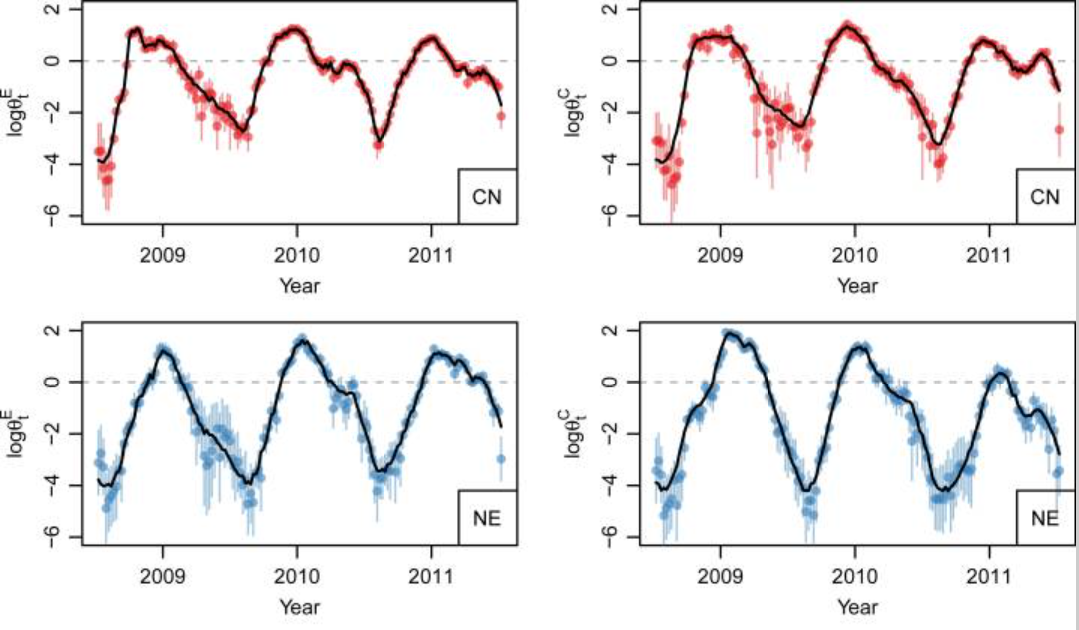
Biometrics. 2017 Mar;73(1):283-293. PMID:27378138. PMCID: PMC5224700. (IF 1.71)In this paper we develop a simple method to quickly obtain weekly stratum-specific estimates of the total number of cases attributable to each pathogen, even when there are few cases subsampled. The estimates can then be used for modeling the pathogen-specific temporal dynamics of interest. Get Full Text
Bayesian penalized spline models for the analysis of spatio-temporal count data
Statistics in Medicine. 2016 May 20;35(11):1848-54.PMID: 26530705. PMCID: PMC4959802. (IF 2.37)In this paper, we describe a model that was motivated by the need to analyze hand, foot, and mouth disease surveillance data in China. The data are aggregated by geographical areas and by week, with the aims of the analysis being to gain insight into the space-time dynamics and to make short-term predictions, which will aid in the implementation of public health campaigns in those areas with a large predicted disease burden. The model we develop decomposes disease-risk into marginal spatial and temporal components and a space-time interaction piece. The latter is the crucial element, and we use a tensor product spline model with a Markov random field prior on the coefficients of the basis functions. Get Full Text
The use of sampling weights in Bayesian hierarchical models for small area estimation
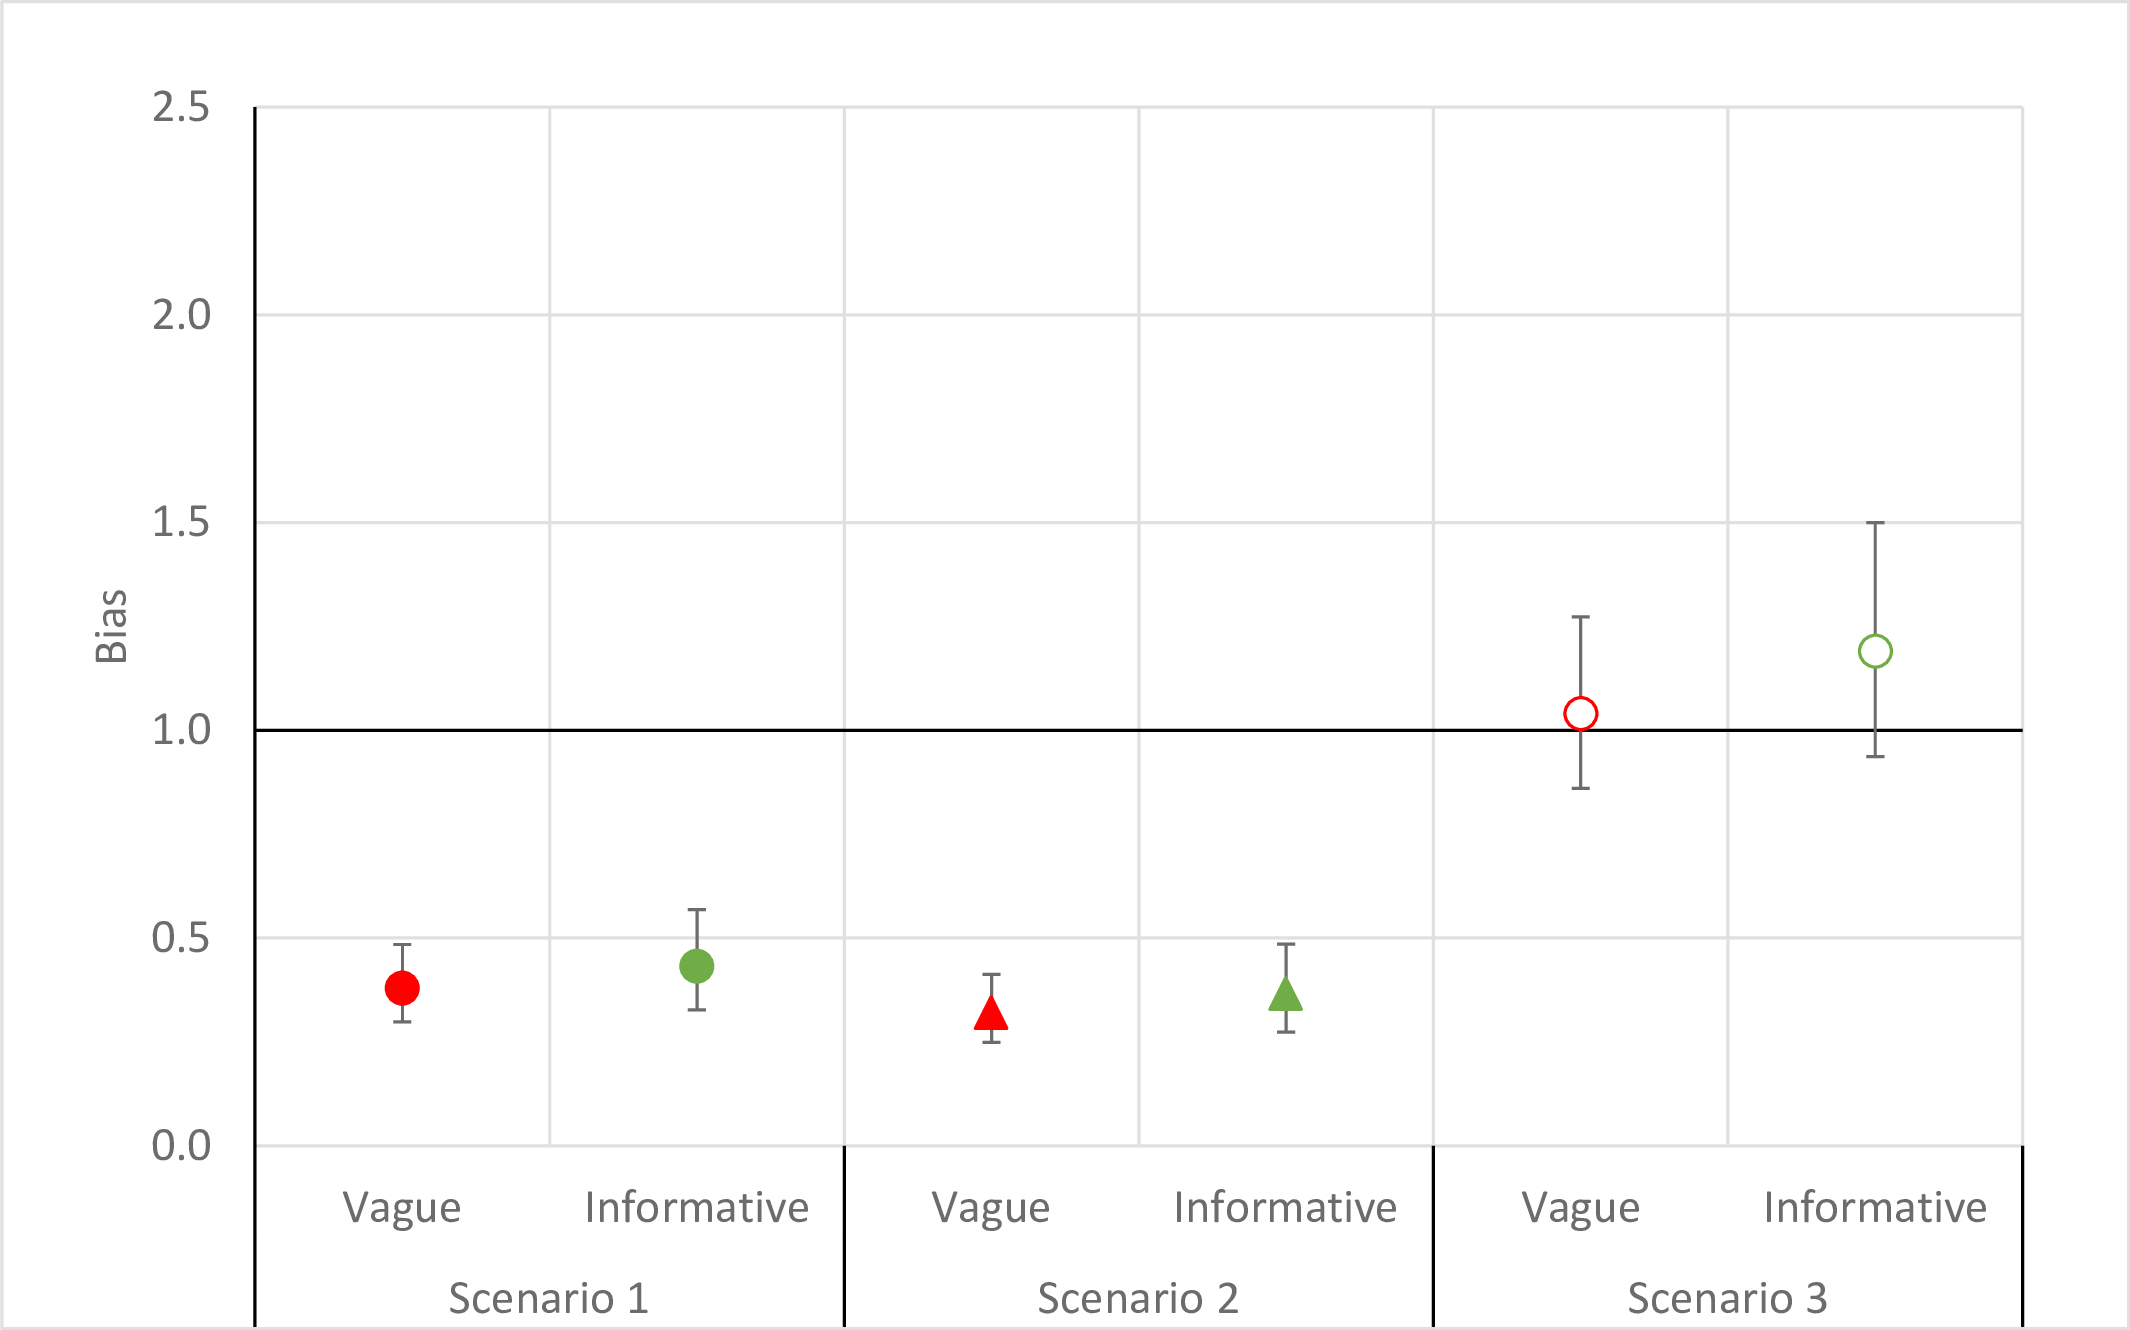
Spatial and Spatio-temporal Epidemiology. 2014 Oct;11:33-43. PMID: 25457595. PMCID: PMC4357363.In this paper, we describe a hierarchical model to acknowledge design weights in a small area estimation context. We also carry out a simulation study and compare our method with a number of alternative hierarchical models and direct estimation. The simulation illustrates how incorporating the weights can reduce bias and hierarchical modeling can reduce variance. Get Full Text
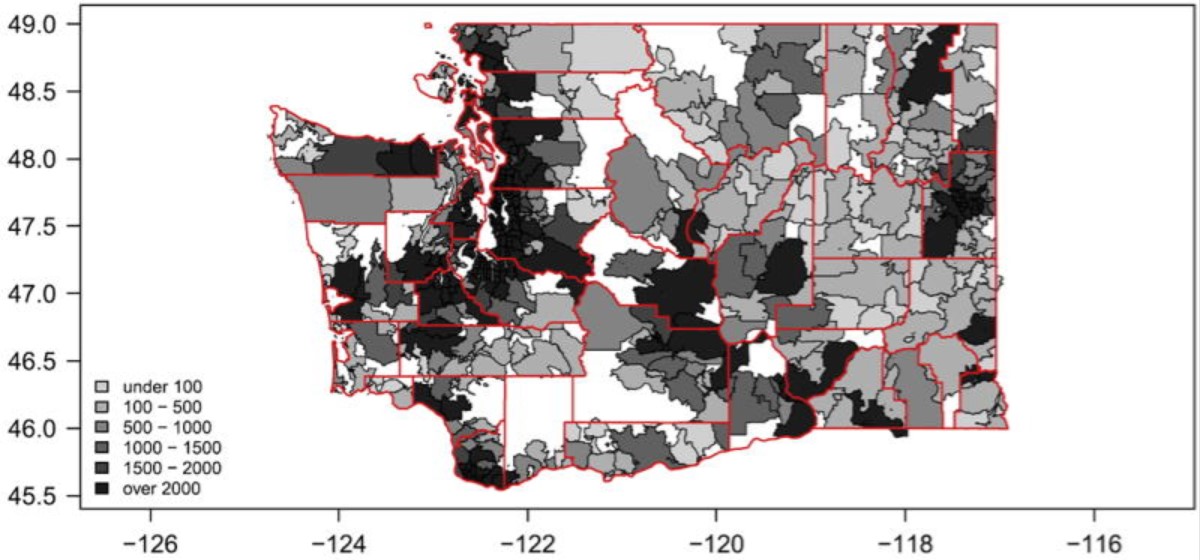
A comparison of spatial smoothing methods for small area estimation with sampling weights
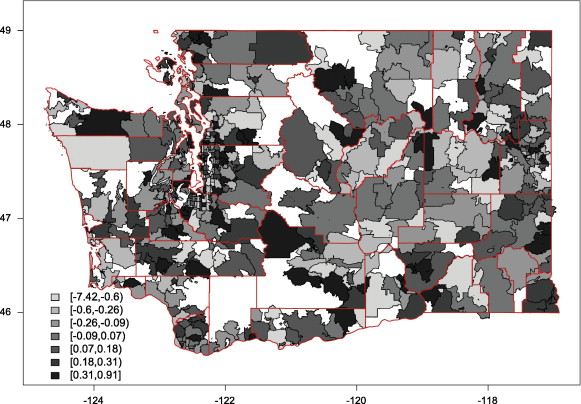
Spatial Statistics. 2014;8:69-85. PMID:24959396. PMCID: PMC4064473. (IF 2.06)To examine the properties of various approaches to estimation we carry out a simulation study, looking at bias due to both non-response and non-random sampling. We also carry out SAE of smoking prevalence in Washington State, at the zip code level, using data from the 2006 Behavioral Risk Factor Surveillance System. Get Full Text
